Image Source: www.kidsdiscover.com
We've all seen the surge in infographics lately, especially on Pinterest, and it seems there's an Infographic on EVERYTHING under the sun. However, I've only recently began using them with students as "informational text"...and they are just perfect because they're (rather) small, not a book or a magazine, but a one page, short snapshot of a whole bunch of information packed neatly into a very small space. For this reason alone, it make reading and deciphering them...complex. For students, nonfiction text structure alone can making reading nonfiction complex, but infographics can be overwhelming because it's the same nonfiction information structured on the page in a very visual way, using many of the same nonfiction text features they are used to seeing in nonfiction texts...tables, graphs, diagrams, labels, etc. As much the information seems "scattered" on the page, we have found there does seem to be some structure to the way the infographic creator made it. At first, kids shy away from "wanting" to untangle all the visual information...but on a "closer" reading and analysis....we are beginning to realize that we'd rather read an infographic than a book with lines upon lines of text or a magazine about the three branches of government when we could glean as much information from some spending some extra time on the infographic.
Here are a few others that utilize many of the text features of non-fiction...
Infographic Source: www.dailyinfographic.com
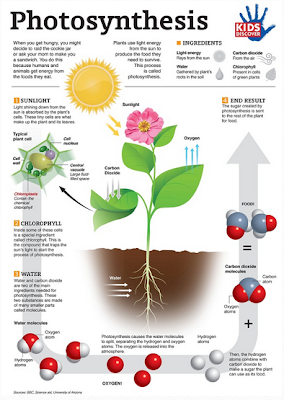
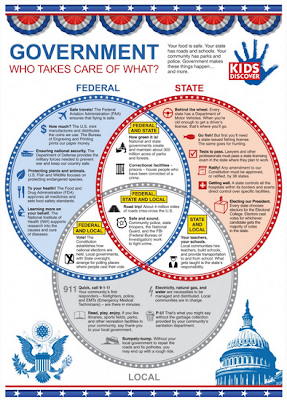
Infographic Source: www.kidsdiscover.com
The NY Times Learning Network also had a great post last year about using Infographics to teach with some great links and places to start.
Happy Reading! -Jen